Understanding the Great Leading vs. Lagging Power Debate
I once watched two engineers/technicians argue for two hours about what power definitions should be displayed on a HMI interface. One of them argued that VARs were being EXPORTED during lagging conditions, so a lagging current should be shown as POSITIVE VARS and Power Factor! The other argued that VARs were IMPORTED during lagging conditions, so a lagging current should be shown as NEGATIVE VARs and Power Factor!
I was fairly new to the business and had no skin in the game, so I couldn’t contribute at the time, but I did find both arguments compelling and the whole scene was hilarious. Now that I’ve had some experience, I realize that they were both correct… from their perspectives.
Here’s an excerpt from The Relay Testing Handbook: Generator Relay Protection Testing that should help clarify how Phasor Diagrams can be interpreted differently by electrical workers with different backgrounds, and why you should NEVER plot a phasor on a Power (P-Q) Diagram:
The Relay Testing Handbook: Generator Relay Protection Testing Excerpt
Chapter 3: Generator Diagrams – B. Phasor Diagrams
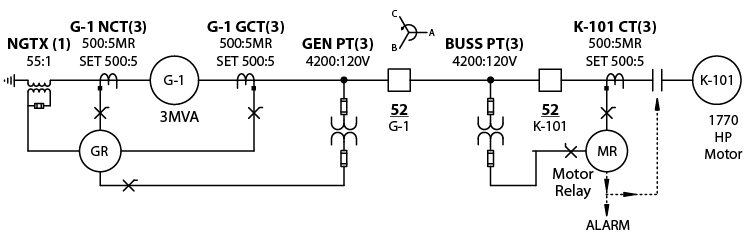
Phasor diagrams can be confusing because different devices use different designations as described in The Relay Testing Handbook: Principles and Practice and Online Course 1-2: Phasor Drawings for Relay Testers. Evaluating phasors is even more confusing in generator applications because generators also look at the world differently than low-voltage, distribution, and transmission equipment. We can see the differences by looking at the single-line drawing in Figure 3-6 that depicts a simple 5kV system where a generator feeds a motor with Wye-connected PTs.
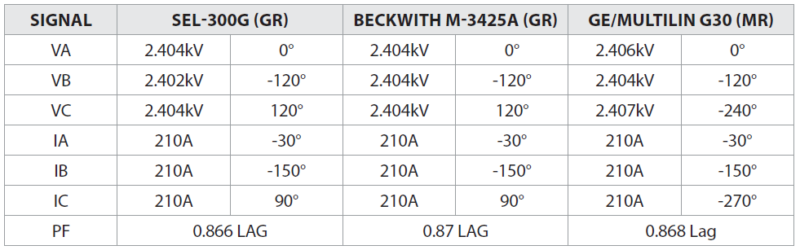
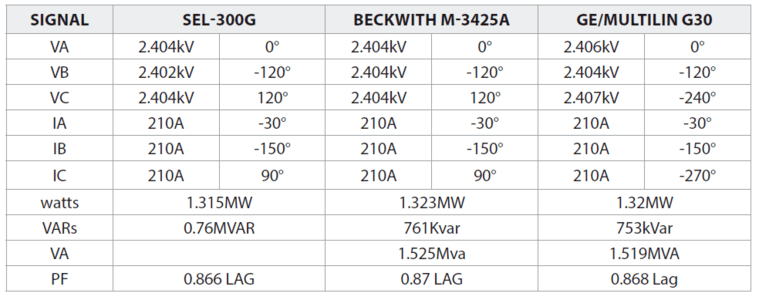
Figures 3-7 and 3-8 show the metering from the SEL-300G and Beckwith M-3425A generator relays included in the GR relay designation in Figure 3-6. The GE/Multilin M60 metering results (designated as MR on the drawing) are also included. If you look closely, you’ll notice that the phase angles for VC and IC are different between devices, but they appear at the same locations on the phasor diagrams. The SEL and Beckwith relays use a combined angle system where the negative symbol indicates a lagging angle and the positive symbol indicates a leading angle. The GE/Multilin M60 (UR) relay uses a lagging angle system, but this system is unique because all of the angles have a negative symbol to let you know that they are lagging. Other angle systems (like the ones used by GE/Multilin SR relays, Megger equipment, and Enoserv RTS) use a lagging angle system, but all their angles are positive.
If you think about the current angle locations a little harder, you might be wondering how it is possible that the currents are at the same location. If you come from a transmission and distribution background where most of the feeders you deal with are loads, the motor imports VARs, so it makes sense that the current lags the voltage. However, the generator exports VARs like a capacitor bank does, but capacitive VARs usually means the current leads the voltage. If you come from a generator background, it makes sense that a lagging current indicates that VARs are leaving the generator, but the motor imports VARs, so its current should lead. What is going on?
All generator relays use the Neutral CTs for most of their functions, including metering for watts, VARs, VA, and PF. If you look back to Figure 3-6, you’ll see that the generator NCTs (G-1 NCT) and the Motor CTs (K-101 CT) face the same direction. The primary current flowing from the generator is the same current flowing into the motor and both CTs face the same direction. Therefore, the secondary currents flow in the same direction in both devices.
The biggest difference between generator personnel and everyone else in the electrical world is how they define leading and lagging currents. A generator technician thinks that the current should lag the voltage when the generator exports VARs, and that the current should lead the voltage when the generator imports VARs. Everyone else thinks the opposite when measuring the current flowing into the motor. If the motor imports VARs, the current lags the voltage. If the motor exports VARs (like a synchronous motor), the relay will see the current lead the voltage.
They’re both correct from their perspectives, but some interesting arguments occur when both sides can’t agree on basic terminology. Imagine you and a co-worker are facing each other and are asked to point to the right. Did you both point in the same direction? If you both were correct about which hand was the right one, you should be pointing in opposite directions. You are both correct, but you have different points of reference. It’s basically the same argument as leading/lagging vs. importing/exporting.
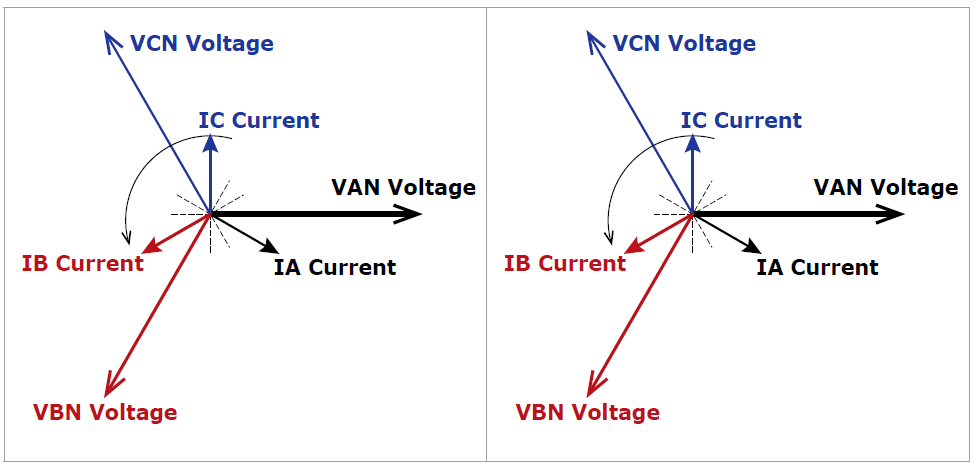
Figure 3-9 shows the “vectorial position of the current with respect to the voltage to show what is meant by import and export for active and reactive power (or energy)”, as per IEC 62053-3. The official drawing was rotated -90° to show the reference voltage on the right-hand side because the voltage was at top dead center in the original, which is not how we draw phasors in the modern age.
The left-hand drawing is the official position that a transmission and distribution person should recognize, and the right-hand drawing shows how the generator person would look at the same phasor position.
Notice that the kW and kVARs positive and negative symbols are the same, only the descriptions changed. We’ll talk about those symbols in the Power Diagrams section of this chapter.
You need to verify your terms with other people when discussing leading and lagging angles vs. watts and VARs. You may not be comparing apples to apples. I use load descriptions to bridge the lagging/leading divide between generation and distribution: The current lags when the load is inductive. Current leads the voltage when the load is capacitive.
Chapter 3: Generator Diagrams – D. Power (P-Q) Drawings
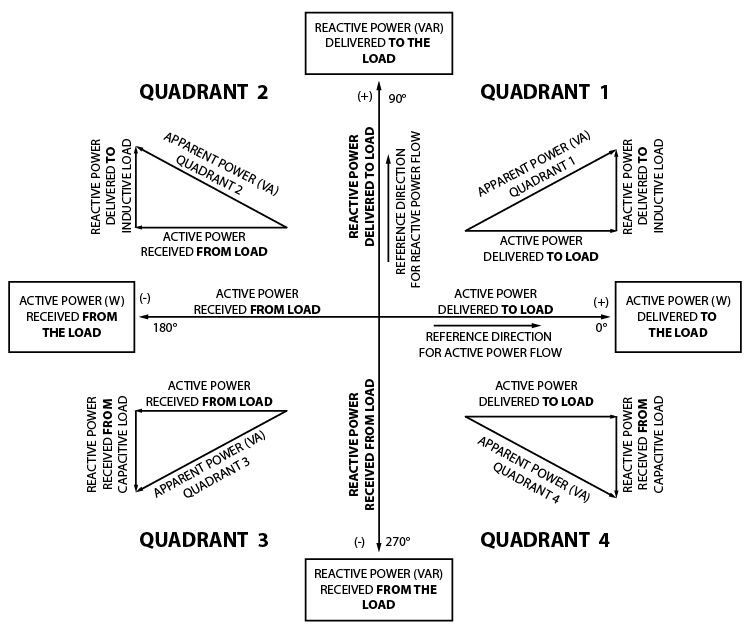
Power drawings display watts, VARs, and VA. This information can help operators understand what the generator is producing to make sure they are meeting the requirements dictated by the system control personnel, and ensure the generator is operating inside its capability curve. These drawings are probably the least understood drawings in the generator world because they look like phasor diagrams, but they are not phasor diagrams. Figure 3-16 depicts a traditional P-Q Drawing template.
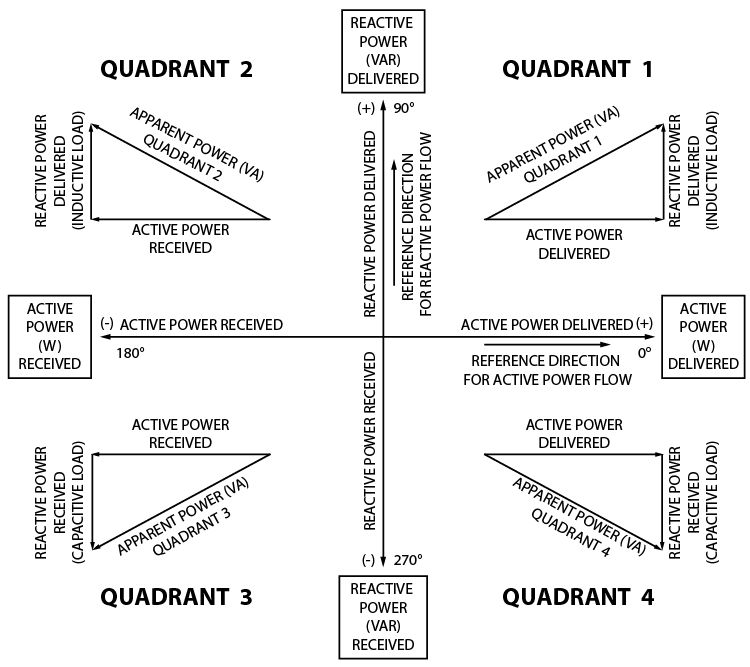
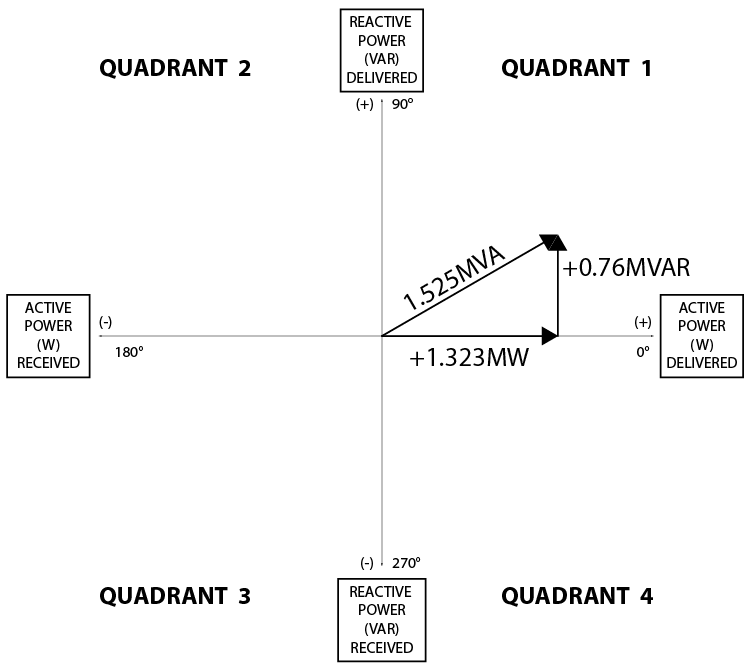
We can use the in-service measurements from previous sections, as shown below, to plot where a normal load falls on the P-Q drawing shown in Figure 3-17.
The watt and VAR measurements are both positive, so that would put our in-service measurements in Quadrant 1, which we would call “leading” if this was a phasor diagram. This could be confusing because the PF measurement indicates a lagging angle. You cannot use the terms “leading” and “lagging” in P-Q diagrams because those terms refer to the rotation and relative position between phasors. Power doesn’t rotate and is an absolute value; therefore, we use quadrants to describe their absolute position on the P-Q diagram.
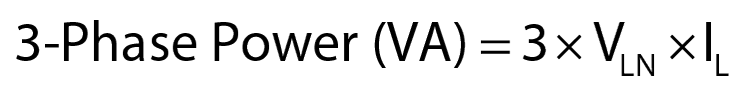
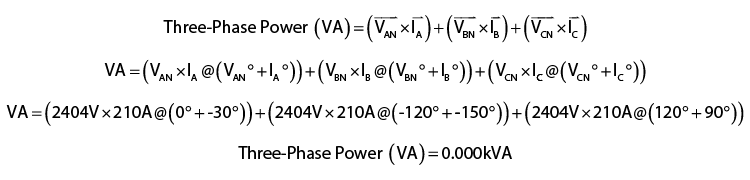
We can check the measurements by calculating Power from the current and voltage measurements with the standard Three-Phase VA formula for P-N values:
You could perform a phasor calculation like the impedance calculations earlier [note: this is described in the original book’s previous section C: Impedance Diagrams], but the procedure for phasor multiplication is slightly different. Multiply the magnitudes as you normally would and ADD the angles as shown below:
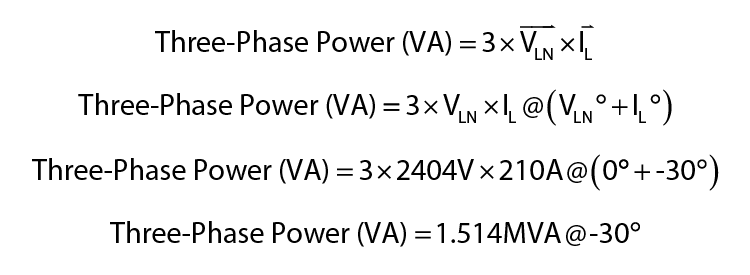
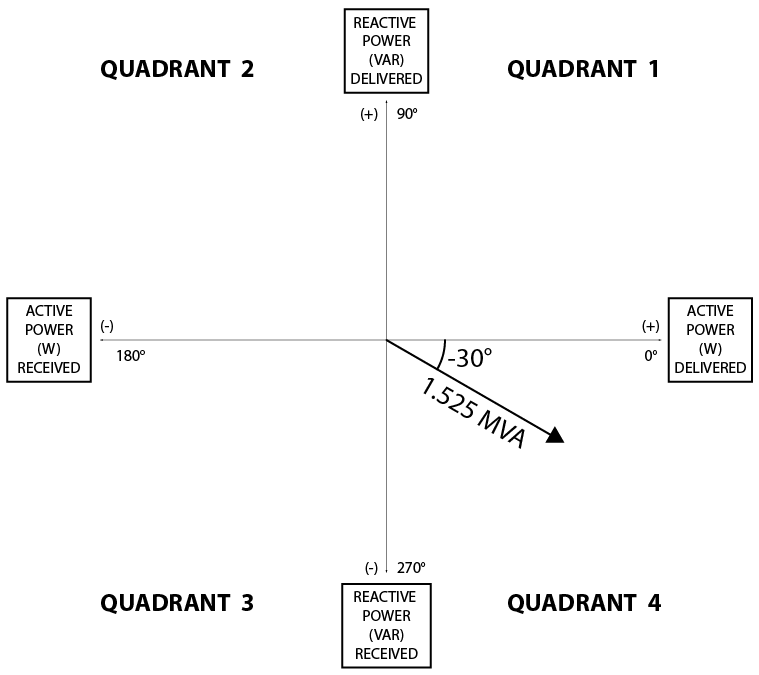
The VA calculation suggests that the result should be plotted in Quadrant 4 because of the -30° angle (Figure 3-18). The actual metering results from the relays do not match our calculations. This should be a major red flag for you because whenever there is a disagreement between your math and three other relays’ calculations, you are the one that’s wrong.
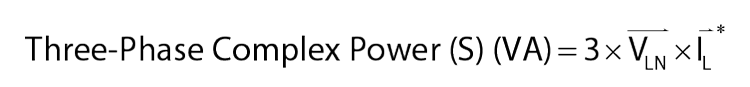
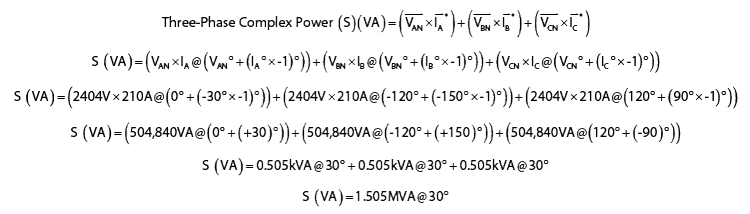
Our calculations are plotted in the wrong quadrant because we are calculating Power when we should be calculating Complex Power. The formulas for Complex Power are nearly the same as Power, except you use the conjugate of the current as depicted by the symbol after IL in the formula:
The conjugate reverses the current sign to turn the static Power calculation into a dynamic Complex Power equation that can be used for any voltage angle. The following Complex Power calculations show how the relays calculate power:
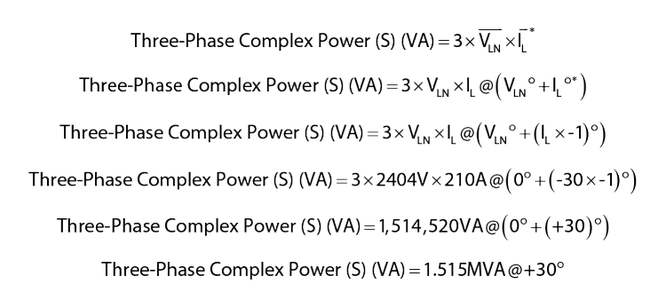
This might seem like a cheat to shoehorn the VARs into the correct location, but there is a mathematical reason for the conjugate. The Three-Phase formula is really just a shortcut. The following calculation depicts the complete VA calculation.
The complete VA calculation incorrectly outputs zero VA with a balanced Three-Phase power system, which obviously isn’t correct. The complex formula outputs the correct power for any power system as shown in the next calculation, which is why it is used in P-Q Drawings and metering standards.
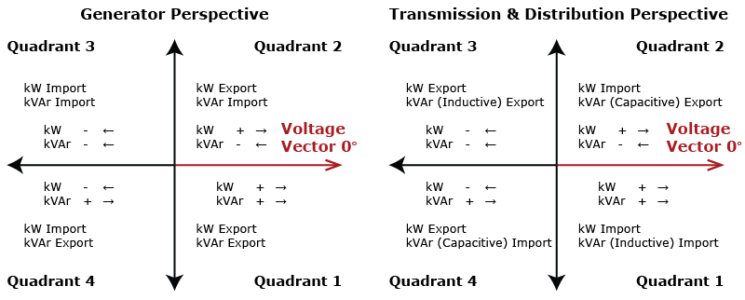
The descriptions in the boxes on each side of the x and y axes from the official drawing will still cause confusion between generation personnel and the rest of the world. I suggest you reword it for yourself to something similar to Figure 3-20 for a universal P-Q Drawing that applies to everyone.
Discover more from Valence Electrical Training Services
Subscribe to get the latest posts sent to your email.
Did you like this post?
You can share it with these links:
Read More Articles:
Testing Loss-of-Field / Loss-of-Excitation Elements (40)
Great content as always Chris
Thanks for the kind words
Never fail to learn something new Chris, always a pleasure to read your articles
Thanks for leaving a comment and the kind words.
Great explanation. How can I set up a time to discuss online training development.
THANKS
Thanks for the detailed explanation. I needed this information
Thanks for the kind words!
1. In Figure 3-9: Phasor Relation to Watts and VARs you mentioned that quadrant 1 and 3 has inductive load , quadrant 2 and 4 has capacitive load.
2. In Figure 3-16: Power/VAR (P-Q) Drawing Standards you mentioned that quadrant 1 and 2 has inductive load , quadrant 3 and 4 has capacitive load.
This confused me.
can please help to clear the doubt.
I’m not sure how to respond to this.
What, exactly, are you confused about?
Did you work through the examples to understand the different diagrams?
Figure 3.6 simplifies the whole of system nicely, perhaps figure 3.9 should maintain the same orientation of components and that both should reference the “infinite bus at the position where device 52 is indicated in figure 3.6; for my perspective having worked in the generation field maintaining consistency throughout simplifies the explanation.
Just recently discovered your work and am greatly appreciative to brush up on concepts covered decades ago.
Regards, Mark D.
Thanks for the kind words and thanks for the suggestion. It should have been that way from the beginning.
Hi Chris,
Great article – refreshed my knowledge.